
Categories
Recent Posts

Greater Toronto Area Real Estate: More Choice, Fewer Buyers in April - What it Means for You

Sparkling Showers: A Simple Guide to Maintaining Your Showerhead (and Your Home's Value)

Your Epic Toronto Weekend Adventure Starts Now! (May 2nd - May 4th, 2025)
Just Listed! Your Mississauga Dream Condo Awaits at 705-4633 Glen Erin Drive
Discover the Allure of 3126 Riverview Street: Your Dream Family Home in Oakville's Coveted Bronte West
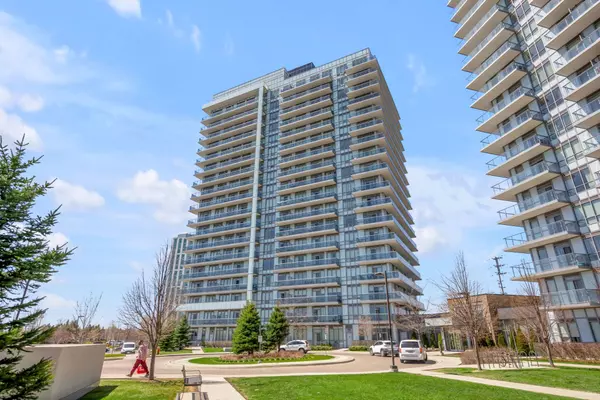
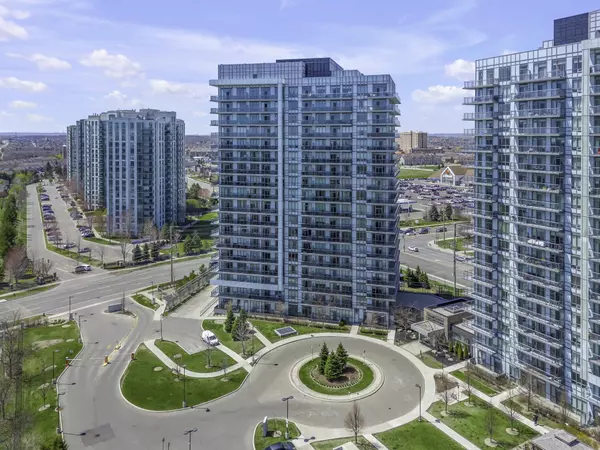
Prime Central Erin Mills Living: Condo with 2 Parking & Stunning Views coming soon on MLS

Toronto This Weekend: A Little Bit of Everything for Everyone!

Breathe Even Easier: A Closer Look at Top Air-Purifying Plants for Your Toronto Home

Modern Mississauga Living at its Finest: Discover 5829 Questman Hollow!
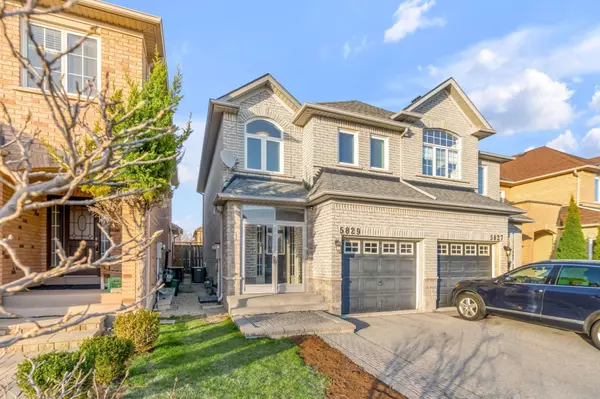
Upgraded Elegance Meets Unbeatable Location at 5829 Questman Hollow, Mississauga
Send us your Questions or Comments.


ABOUT US
Real Impact Group specializes in helping clients achieve their heart's desire through Real Estate. While making a lasting IMPACT on our clients' lives, we also treat each one as a valued member of our family.
130 KING ST W UNIT 1800B TORONTO,
Ontario M5X1E3, Canada
+1(647) 271-5461
RESOURCES
VISIT US ON YOUTUBE
Are you thinking about moving to Toronto and surrounding areas? This channel is all about living in Toronto Canada, moving to Toronto Canada, and relocating to Toronto Canada. If you want to know everything about eating, sleeping, working, playing, and the good and bad of living in Toronto and surrounding areas, then subscribe & tap the for notifications 🔔 so you can be the first to know about the current market in Toronto.
![]()